在云原生的开发下,POD一般都需要自动扩缩容以适应业务的开发环境(否则不如直接部署在VPS上了)。传统的HPA会使用CPU或者内存来扩缩容,但是对于某些特殊业务,我们会根据自定义指标(例如qps,特殊资源的使用情况)来决定是否需要扩容。
自定义指标
在使用HPA之前,我们首先需要能导出自定义指标。k8s提供了两个形式的自定义指标API,External Metrics API和Custom Metrics API。
一般情况下External Metrics API的用途是用于衡量外部对象(和k8s内部署的对象无关)的指标。举个例子,我们在云服务中使用到了消息队列,此时可以使用External Metrics API获取消息队列的长度,并用来作为我们是否要对消费者pod进行扩缩容的判断指标。
Custom Metrics API更关注k8s本身的资源,例如服务的qps,pod的最大进程数等。因此正常情况下我们会选择使用Custom Metrics API做为业务自定义指标。对于Custom Metrics,通常不会直接操作或者设置,而是借由一些监控数据转换得到,例如Prometheus和Opentelemetry。本文我们不讨论Opentelemetry(其实是我没用过),聚焦在如何将Prometheus数据作为自定义指标。
配置k8s集群
通常情况下,你已经有了一个集群,它可能来自于云服务商或者你所在公司的运维团队。如果你没有一个k8s集群,或者没有对应k8s集群的权限,我推荐你尝试一下在wsl下搭建自己的测试集群。
在本章我们需要给k8s集群分别安装Metrics Server,Prometheus,Prometheus Adaptor。如果你的集群里都有这些,可以略过。
为了获取监控指标,我们需要Metrics Server。执行以下指令,
1
2
|
kubectl get deployment metrics-server -n kube-system
|
如果报错就需要安装 metrics-server。先下载配置:
1
| wget https://github.com/kubernetes-sigs/metrics-server/releases/latest/download/components.yaml
|
如果你的集群没有安装tls证书,请不要直接安装。找到metrics-server的启动参数,增加一行--kubelet-insecure-tls:
1
2
3
4
5
6
7
8
9
10
11
12
13
14
15
16
17
| apiVersion: apps/v1
kind: Deployment
...
spec:
...
template:
...
spec:
containers:
- args:
- --cert-dir=/tmp
- --secure-port=4443
- --kubelet-preferred-address-types=InternalIP,ExternalIP,Hostname
- --kubelet-use-node-status-port
- --metric-resolution=15s
- --kubelet-insecure-tls
...
|
之后再执行安装:
1
| kubectl apply -f components.yaml
|
否则可能会发现metrics-server一直无法Ready,查看log的时候发现报X509错误。
之后我们需要安装Prometheus和Prometheus Adaptor,前者用于搜集服务暴露的指标,后者用于将Prometheus的指标转换成Custom Metrics:
1
2
3
4
5
| # 将Prometheus的仓库加入到helm仓库中
helm repo add prometheus-community https://prometheus-community.github.io/helm-charts
# 安装Prometheus
kubectl create namespace prometheus
helm install prometheus prometheus-community/kube-prometheus-stack -n prometheus
|
如果你没有安装Helm,就需要安装一个。这是类似Ubuntu上的apt包管理器的组件。
此时k8s集群已经配置完成,执行以下指令获取当前的自定义指标(当然目前还啥都没有)。
1
2
3
4
5
6
7
8
| kubectl get --raw /apis/custom.metrics.k8s.io/v1beta1 | jq
# 输出
{
"kind": "APIResourceList",
"apiVersion": "v1",
"groupVersion": "custom.metrics.k8s.io/v1beta1",
"resources": []
}
|
Prometheus指标导出
如果你用的是go,只需要引入对应的库,比较简单,因此我们用go作为样例:
1
2
3
4
5
6
7
8
9
10
11
12
13
14
15
16
17
18
19
20
21
22
23
24
25
| package main
import (
"net/http"
"github.com/prometheus/client_golang/prometheus"
"github.com/prometheus/client_golang/prometheus/promauto"
"github.com/prometheus/client_golang/prometheus/promhttp"
)
var (
opsProcessed = promauto.NewCounter(prometheus.CounterOpts{
Name: "myapp_processed_ops_total",
Help: "The total number of processed events",
})
)
func main() {
http.Handle("/metrics", promhttp.Handler())
http.HandleFunc("/", func(w http.ResponseWriter, r *http.Request) {
opsProcessed.Inc()
_, _ = w.Write([]byte("Hello, World!"))
})
_ = http.ListenAndServe(":8080", nil)
}
|
编译之后启动可以查看效果:
1
2
3
4
| # 模拟请求
curl http://localhost:8080/
# 查看请求之后的指标数据
curl http://localhost:8080/metrics | grep myapp_processed_ops_total
|
此时,我们的服务已经能够暴露出prometheus指标。在样例中记录了请求的总记录数目。当然prometheus实践上还有很多记录指标形式,大家可以根据需求自行采用。
服务部署
实现了服务之后,我们需要将这个服务部署到k8s集群中。首先,需要打包成一个镜像,在上文的go工程目录中新建一个Dockerfile:
1
2
3
4
5
6
|
FROM golang:1.21
WORKDIR /app
COPY ./test /app/test
RUN chmod +x /app/test
ENTRYPOINT ["./test"]
|
打包一个名为test_prometheus的镜像:
1
| docker build -t test_prometheus .
|
接下来如果你有自己的镜像服务,应该使用docker push推送到自己的镜像仓库。如果像我一样使用kind搭建的服务,而且也不想将测试镜像上传的话,可以将镜像加载到集群内:
1
| kind load docker-image test_prometheus:latest --name kind # --name 代表集群名字
|
接下来,写一个Deployment将镜像部署到集群中:
1
2
3
4
5
6
7
8
9
10
11
12
13
14
15
16
17
18
19
20
21
|
apiVersion: apps/v1
kind: Deployment
metadata:
name: test-prometheus
spec:
replicas: 1
selector:
matchLabels:
app: test-prometheus
template:
metadata:
labels:
app: test-prometheus
spec:
containers:
- name: test-prometheus
image: test_prometheus:latest
imagePullPolicy: IfNotPresent
ports:
- containerPort: 8080
|
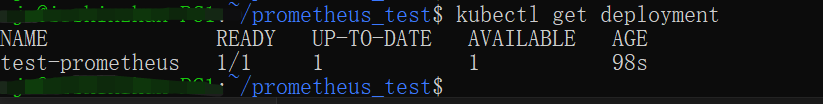
执行以下指令部署,此时可以看到已经能跑起来一个测试服务了:
1
2
3
4
| # 部署服务
kubectl apply -f deployment.yaml
# 查看服务
kubectl get deployment
|
效果如下:
为了能够从集群外部访问服务,我们还需要再建立一个Service资源,以便用NodePort方式暴露我们的服务(使用LoadBalancer也可以,但是我也懒得配置了):
1
2
3
4
5
6
7
8
9
10
11
12
13
14
15
16
17
|
apiVersion: v1
kind: Service
metadata:
name: test-prometheus
labels:
app: test-prometheus
spec:
selector:
app: test-prometheus
ports:
- protocol: TCP
port: 8080
targetPort: 8080
nodePort: 30000
name: prometheus-port
type: NodePort
|
直接部署到k8s平台内,如果你之前也是像我一样用kind部署的,那么本机30000端口是可以映射到controller panel的30000端口的:
1
2
3
4
5
| kubectl apply -f service.yaml
curl http://127.0.0.1:30000
# 输出 Hello World
# 可以看到prometheus指标
curl http://127.0.0.1:30000/metrics
|
此时,Prometheus还不知道需要获取这个服务的统计指标。一般情况下有两种方式,一是修改Prometheus的配置文件,但是这种方式耦合性太强(试想,你每次部署一个新的服务,或者删除一个新的服务都要去各种集群上修改Prometheus的配置,几乎不可维护)。因此我推荐第二种方式,使用ServiceMonitor,首先新建一个配置文件:
1
2
3
4
5
6
7
8
9
10
11
12
13
| apiVersion: monitoring.coreos.com/v1
kind: ServiceMonitor
metadata:
name: test-prometheus
labels:
release: prometheus
spec:
selector:
matchLabels:
app: test-prometheus
endpoints:
- port: prometheus-port
interval: 10s
|
将这个配置部署到k8s集群之后prometheus会开始采集这个指标kubectl apply -f monitor.yaml。
这里需要说明的是,ServiceMonitor是用于监控Service的伪CRD,因此里边出现的Label和EndPoint也需要和Service中的匹配。当然如果你不需要Service,也可以考虑PodMonitor去抓取Pod的监控指标。
如果一切正常,我们可以在集群中查询到Prometheus指标。登录任意一个pod,例如我们的测试服务,之后执行查询指令:
1
2
3
4
5
6
7
8
9
10
11
12
13
14
15
16
17
18
19
20
21
22
23
24
25
26
27
28
29
| kubectl get pods
#NAME READY STATUS RESTARTS AGE
#test-prometheus-57dc8d4c68-kjqs4 1/1 Running 0 19h
kubectl exec -it test-prometheus-57dc8d4c68-kjqs4 -- curl http://prometheus-kube-prometheus-prometheus.prometheus:9090/api/v1/query --data-urlencode 'query=myapp_processed_ops_total' | jq
# 应该显示类似输出
{
"status": "success",
"data": {
"resultType": "vector",
"result": [
{
"metric": {
"__name__": "myapp_processed_ops_total",
"container": "test-prometheus",
"endpoint": "prometheus-test",
"instance": "10.244.1.5:8080",
"job": "test-prometheus",
"namespace": "default",
"pod": "test-prometheus-57dc8d4c68-kjqs4",
"service": "test-prometheus"
},
"value": [
1695018199.504,
"1"
]
}
]
}
}
|
一切正常之后说明Prometheus的指标已经正常导出了。
Prometheus指标转换为k8s自定义指标
获取了Prometheus的指标之后,并不能直接使它可以变成HPA要用到的k8s自定义指标。因此我们需要一个转换器,将需要的Prometheus指标转换过来。二者关系如图所示:

首先安装Prometheus-Adaptor:
1
2
| # 安装Prometheus-Adaptor
helm install prometheus-adapter prometheus-community/prometheus-adapter -n prometheus --set prometheus.url=http://prometheus-kube-prometheus-prometheus.prometheus --set prometheus.port=9090
|
这里需要额外需要注意的是prometheus.url,因为默认安装的情况下Prometheus Adaptor的url是prometheus.default.svc,此时如果使用默认配置Prometheus Adaptor会找不到Prometheus服务。
此时再执行下列指令会看到茫茫多输出(都是Prometheus Adator自带的):
1
2
3
4
5
6
7
8
9
10
11
12
13
14
15
16
17
| kubectl get --raw /apis/custom.metrics.k8s.io/v1beta1 | jq
# 输出
{
"kind": "APIResourceList",
"apiVersion": "v1",
"groupVersion": "custom.metrics.k8s.io/v1beta1",
"resources": [
{
"name": "services/grafana_api_dashboard_search_milliseconds_sum",
"singularName": "",
"namespaced": true,
"kind": "MetricValueList",
"verbs": [
"get"
]
},
...
|
此时修改Prometheus Adaptor的配置,在rules下添加我们的配置:
1
2
| # 编辑配置
kubectl edit configmap prometheus-adapter -n prometheus
|
1
2
3
4
5
6
7
8
9
10
11
| - metricsQuery: 'avg(<<.Series>>{<<.LabelMatchers>>}) by (<<.GroupBy>>)'
name:
as: myapp_processed_ops_total
matches: ^(.*)myapp_processed_ops_total
resources:
overrides:
namespace:
resource: namespace
pod:
resource: pods
seriesQuery: '{__name__=~"^(.*)myapp_processed_ops_total$"}'
|
1
2
| # 重启Adaptor
kubectl rollout restart deployment prometheus-adapter -n prometheus
|
具体配置规则的方式可以参考官方文档。
此时再请求自定义配置,我们就可以获取到自定义的配置了:
1
2
3
4
5
6
7
8
9
10
11
12
13
14
15
16
17
18
19
20
21
| kubectl get --raw /apis/custom.metrics.k8s.io/v1beta1/namespaces/default/pods/*/myapp_processed_ops_total | jq
# 输出
{
"kind": "MetricValueList",
"apiVersion": "custom.metrics.k8s.io/v1beta1",
"metadata": {},
"items": [
{
"describedObject": {
"kind": "Pod",
"namespace": "default",
"name": "test-prometheus-57dc8d4c68-kjqs4",
"apiVersion": "/v1"
},
"metricName": "myapp_processed_ops_total",
"timestamp": "2023-09-18T08:33:18Z",
"value": "1",
"selector": null
}
]
}
|
配置HPA
直接新建配置hpa.yaml并且部署:
1
2
3
4
5
6
7
8
9
10
11
12
13
14
15
16
17
18
19
| apiVersion: autoscaling/v2
kind: HorizontalPodAutoscaler
metadata:
name: test-prometheus-hpa
spec:
scaleTargetRef:
apiVersion: apps/v1
kind: Deployment
name: test-prometheus
minReplicas: 1
maxReplicas: 10
metrics:
- type: Pods
pods:
metric:
name: myapp_processed_ops_total
target:
type: AverageValue
averageValue: 3
|
1
| kubectl apply -f hpa.yaml
|
此时查看hpa:
1
2
3
4
| kubectl get hpa
# 输出
NAME REFERENCE TARGETS MINPODS MAXPODS REPLICAS AGE
test-prometheus-hpa Deployment/test-prometheus 1/3 1 10 1 60s
|
重复curl几次使得我们的指标升级上去:
1
2
3
4
5
6
7
| # 重复执行以下几次
curl http://127.0.0.1:30000
# 获取hpa
kubectl get hpa
# 输出
NAME REFERENCE TARGETS MINPODS MAXPODS REPLICAS AGE
test-prometheus-hpa Deployment/test-prometheus 4/3 1 10 1 4m22s
|
最后可以发现因为指标超过了target之后会自动扩容:
1
2
3
4
| kubectl get hpa
# 输出
NAME REFERENCE TARGETS MINPODS MAXPODS REPLICAS AGE
test-prometheus-hpa Deployment/test-prometheus 2/3 1 10 2 4m47s
|
至此我们就已经完成了根据自定义指标来实现自动扩缩容。
之后我们可以使用qps等指标替换测试指标,实现根据业务的情况自动扩缩容pods。
总结
总体流程如下图:
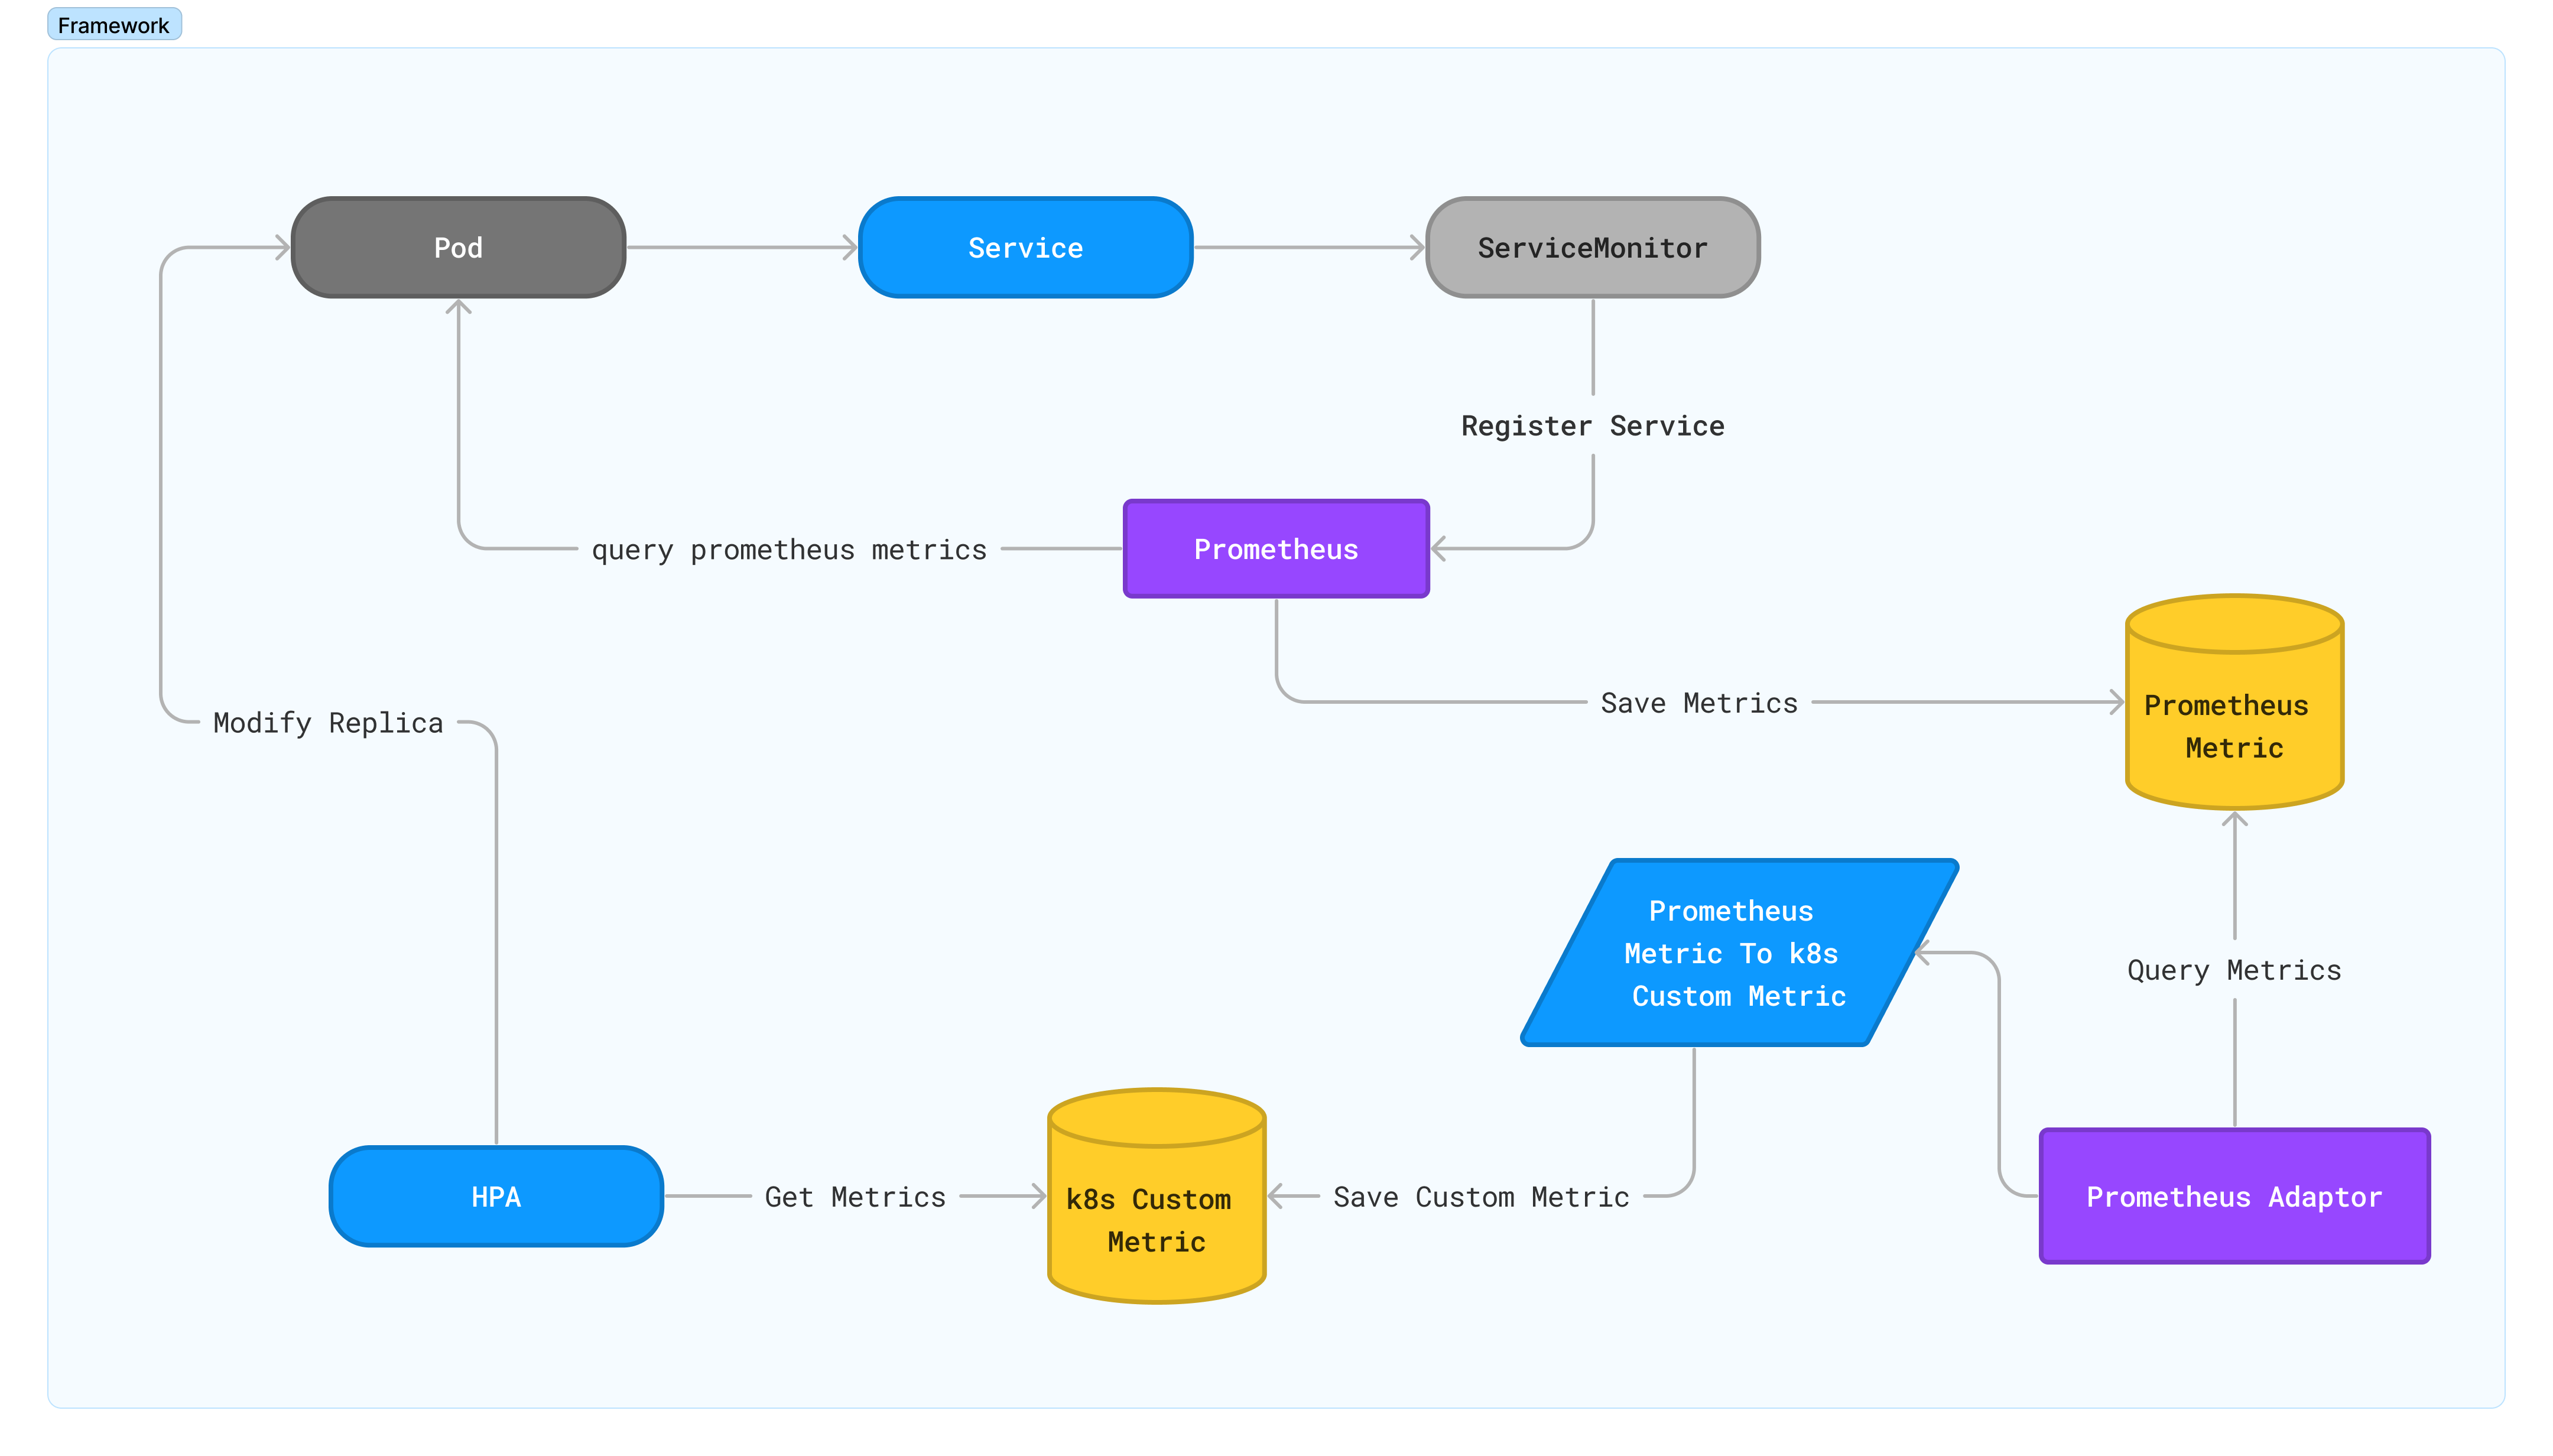
整体来说为了将服务的Prometheus的指标用于HPA,绕了一个大圈。